

Austin Housing Market 2025: Freddie Mac House Price Index April Update
Published | Posted by Dan Price
Austin Housing Market Trends: Freddie Mac House Price Index (FMHPI®) Insights for April 2025
The Freddie Mac House Price Index (FMHPI®) released its latest data on April 30, 2025, providing a detailed look at home price trends across the United States. This index tracks price changes for the same properties over time, offering a reliable measure of housing market shifts compared to basic sale price averages. The April 2025 report highlights significant developments in the Austin-Round Rock-Georgetown area, alongside trends in other major metro areas. Available on teamprice.com, the data serves as a valuable resource for understanding the housing market’s current state and its implications for buyers, sellers, and real estate professionals.
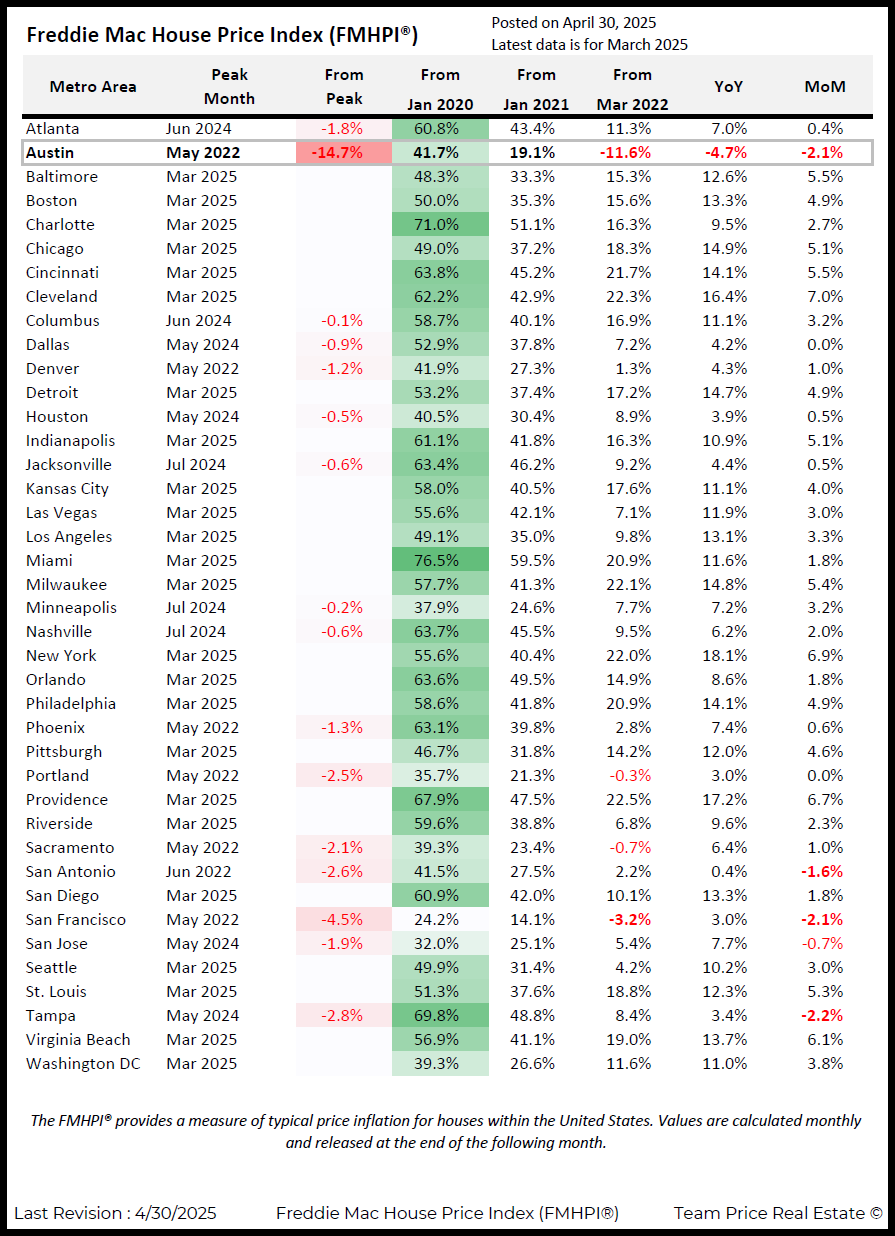
Austin’s housing market has experienced notable changes in recent years. From January 2020 to its peak in May 2022, home prices in the Austin-Round Rock-Georgetown area surged 41.7%, driven by strong demand from tech industry growth and new residents. However, as of April 30, 2025, prices have declined 14.7% from that peak, marking the largest drop among Texas metro areas and one of the most significant nationwide. The national average drop from peak prices is only 1.0%, underscoring Austin’s pronounced correction. Year-over-year, Austin’s prices fell 4.7%, while the national average rose 9.6%. Month-over-month, Austin saw a 2.1% decline, compared to a national increase of 2.72%. These figures reflect a cooling market, but recent data suggests potential stabilization.
Comparing Austin to other Texas metro areas provides further context. Houston’s home prices have increased 3.9% year-over-year and are down just 0.5% from their May 2024 peak. Dallas has seen a 4.2% year-over-year gain and a modest 0.9% drop from its May 2024 peak. San Antonio, however, is down 2.6% from its June 2022 peak, with a minimal 0.4% year-over-year increase. Austin’s decline stands out, but the broader Texas market shows varied performance, with some areas maintaining growth despite national and regional challenges.
Nationally, the FMHPI® data reveals a diverse housing landscape. Miami has seen the largest price increase since January 2020, with a 76.5% gain, followed by Charlotte at 71.0% and Cleveland at 62.2%. New York leads year-over-year growth with an 18.1% increase, while Miami follows closely at 16.9%. In contrast, other metro areas are experiencing declines similar to Austin. San Francisco is down 4.5% from its May 2022 peak, Tampa is off 2.8% from May 2024, and Portland has dropped 2.5% from May 2022. Sacramento is down 2.1% from its May 2022 peak. Smaller markets like Punta Gorda, Florida, and Cape Coral-Fort Myers, Florida, have seen sharper declines of 10.6% and 10.0%, respectively, from their peaks. The data indicates that 38% of the 384 cities tracked, or 146 cities, are below their peak prices, while 62%, or 238 cities, reached their peak in March 2025.
The FMHPI® report also provides a broader perspective on national trends. Since January 2020, home prices across the U.S. have risen by an average of 53.3%. From January 2021, the average increase is 37.1%, and from March 2022, it’s 11.5%. The national year-over-year price change averages 9.6%, and the month-over-month change is 2.72%. These figures highlight a generally upward trend, with most metro areas continuing to see price growth, though markets like Austin are exceptions due to their significant corrections.
Austin’s historical data offers additional insight into its market dynamics. The FMHPI® includes month-over-month and year-over-year price changes for Austin dating back to 1976. For example, in 1983, Austin saw a peak month-over-month increase of 5.6% in January, while in October 1983, the year-over-year change reached 31.37%. More recently, September 2021 recorded a year-over-year increase of 33.22%, reflecting the pandemic-era boom. These historical peaks contrast with the current 2.1% month-over-month decline and 4.7% year-over-year drop, illustrating the market’s volatility over time.
The April 2025 data suggests that Austin’s correction may be easing. The 2.1% month-over-month decline is less severe than the 2.6% drop reported in March 2025, indicating a potential slowdown in price declines. Nationally, the fact that 238 of 384 metro areas peaked in March 2025 points to a broader trend of stabilization, which Austin may soon follow. This is supported by stabilizing inventory levels and early signs of renewed buyer interest in the Austin market, as reported in the FMHPI® data.
Across the 384 cities tracked, the FMHPI® identifies 146 cities, or 38%, as being down from their peak prices. Austin’s 14.7% drop is the largest, followed by Punta Gorda, Florida, at 10.6% and Cape Coral-Fort Myers, Florida, at 10.0%. Other notable declines include Lake Charles, Louisiana, at 7.5% from June 2022, and Homosassa Springs, Florida, at 6.4% from April 2024. The data also shows that 25 cities peaked in May 2022, with an average drop of 2.5%, while 35 cities peaked in both May 2024 and July 2024, with average drops of 1.7% and 1.3%, respectively. This distribution underscores the varied timing and magnitude of price corrections across the U.S.
The FMHPI® serves as a critical tool for understanding these trends, offering data that is updated monthly and released at the end of the following month. The April 2025 report, available as a PDF on teamprice.com, provides detailed tables and visualizations, including a breakdown of Austin’s month-over-month and year-over-year changes. This resource allows users to compare metro areas, track historical trends, and analyze current market conditions with precision.
In summary, the April 2025 FMHPI® data paints a complex picture of the U.S. housing market, with Austin experiencing one of the largest corrections at a 14.7% drop from its May 2022 peak. While year-over-year and month-over-month declines of 4.7% and 2.1% reflect ongoing challenges, signs of stabilization are emerging. Compared to thriving markets like Miami and New York, or more stable Texas metros like Houston and Dallas, Austin’s market is distinct. The FMHPI® data, accessible on teamprice.com, offers a comprehensive view of these trends, making it an essential resource for navigating the housing market in 2025.
FAQ Section
What is the Freddie Mac House Price Index (FMHPI®)?
The Freddie Mac House Price Index (FMHPI®) is a monthly index that tracks home price changes for the same properties across the U.S., providing a reliable measure of housing market trends. Unlike average sale prices, which can vary based on the types of homes sold, the FMHPI® focuses on consistent properties to reflect true price inflation. The April 2025 report, available on teamprice.com, details price changes for 384 cities, including Austin’s 14.7% drop from its May 2022 peak.
How have home prices in Austin changed in 2025?
As of April 30, 2025, Austin’s home prices are down 14.7% from their May 2022 peak, with a 4.7% year-over-year decline and a 2.1% month-over-month drop, according to the FMHPI®. These figures reflect a significant correction, though the 2.1% month-over-month decline is less severe than March 2025’s 2.6%, suggesting potential stabilization. Austin’s trends are detailed in the April 2025 report on teamprice.com.
Which U.S. cities have seen the largest home price increases?
The FMHPI® data for April 2025 shows Miami with the largest price increase since January 2020 at 76.5%, followed by Charlotte at 71.0% and Cleveland at 62.2%. New York leads year-over-year growth with an 18.1% increase, while Miami follows at 16.9%. These trends contrast with Austin’s 14.7% drop from its peak, as reported on teamprice.com.
Request Info
Have a question about this article or want to learn more?
